
A good rental-property return depends on the market, property type, financing, and risk, with a cap rate of roughly 4%–6% serving as a starting point in many major, lower-risk metropolitan markets. Compare that normalized operating yield with cash-on-cash return, debt-service coverage, and total ROI rather than relying on a single headline percentage.
You may be reviewing a rental that looks profitable in the listing, only to find that the insurance quote, repair estimate, and proposed loan payment leave less cash than you expected. The question isn't whether the advertised return sounds attractive. It's whether the income you can reasonably collect will support the property, the financing, and an adequate cushion for surprises.
Why Rental Property Returns Are Hard to Compare
Consider an investor reviewing competing rental listings. Both advertise similar gross yields, but one has established tenants and documented maintenance, while the other relies on projected rents and needs work before it can attract tenants.
The purchase prices might look equally appealing. The ownership experience won't necessarily be equal.
Once the investor subtracts missed rent, property taxes, insurance, repairs, management, and loan payments, the apparent similarity can disappear. This is an illustrative comparison, not a completed investment case study.
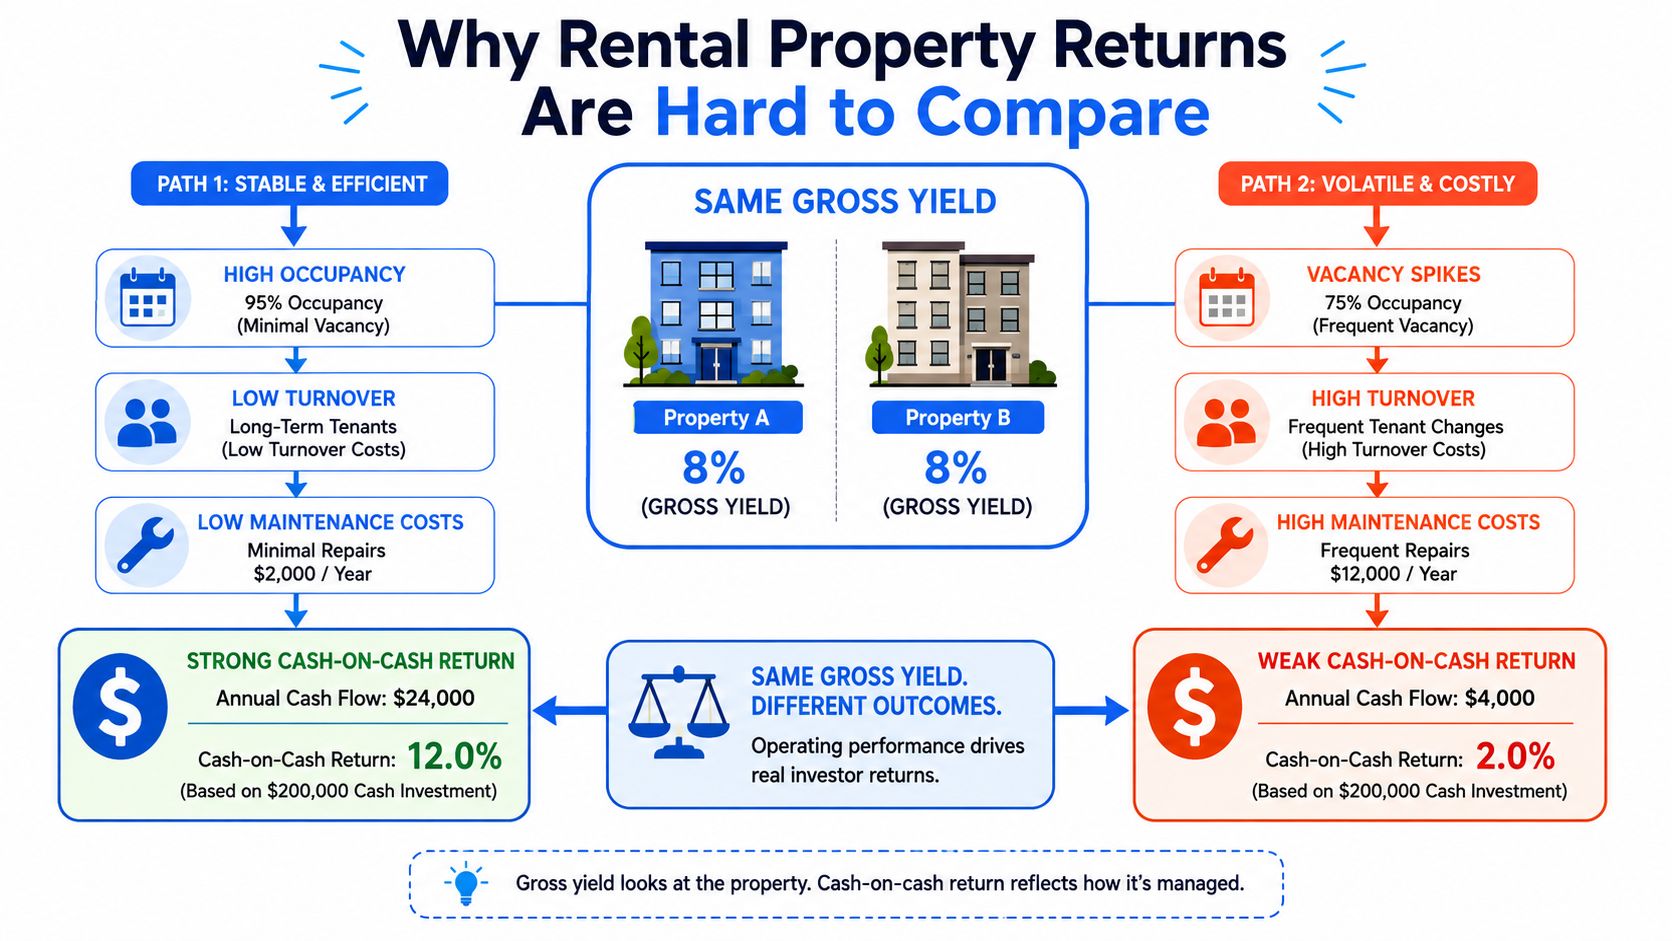
Separate the building from the borrowing
Operating performance describes what the property earns before financing. Investor performance describes what the owner receives after financing and other investment costs.
That distinction prevents a common mistake: treating favorable loan terms as proof that a property is well priced. It also prevents dismissing a sound building because a particular loan structure produces weak cash flow.
Four return measures investors should keep separate
| Measure | What it measures | Main inputs | Important limitation |
|---|---|---|---|
| Gross yield | Rent relative to price | Potential annual rent, purchase price | Ignores expenses and financing |
| Cap rate | Unlevered operating yield | Normalized NOI, property value | Doesn't measure owner distributions |
| Cash-on-cash return | Cash earned on invested equity | Cash flow, cash invested | Excludes unrealized appreciation |
| Total return | Income and changes in investment value | Distributions, equity growth, costs | Depends on valuation and timing assumptions |
Don't substitute rent growth for profitability
Historical figures summarized by Rutgers' Center for Real Estate describe real home-price growth of about 5% over roughly 70 years, report approximately 0.3% annually after inflation, and show renter-paid real rents rising about 0.5% annually from the end of 1982, accelerating to roughly 1.5% annually from October 2010 through the period analyzed.
The practical lesson is to keep appreciation expectations conservative. A durable income stream can justify an investment without aggressive growth assumptions, while rising rents alone don't establish that the owner is earning an adequate return.
Build a Rental Property Return Framework
Start with rent you can support, not rent you hope to achieve. Use existing leases, collection records, and comparable available rentals to distinguish current income from future leasing assumptions.
Then follow the money through the property before deciding how much debt it can support.
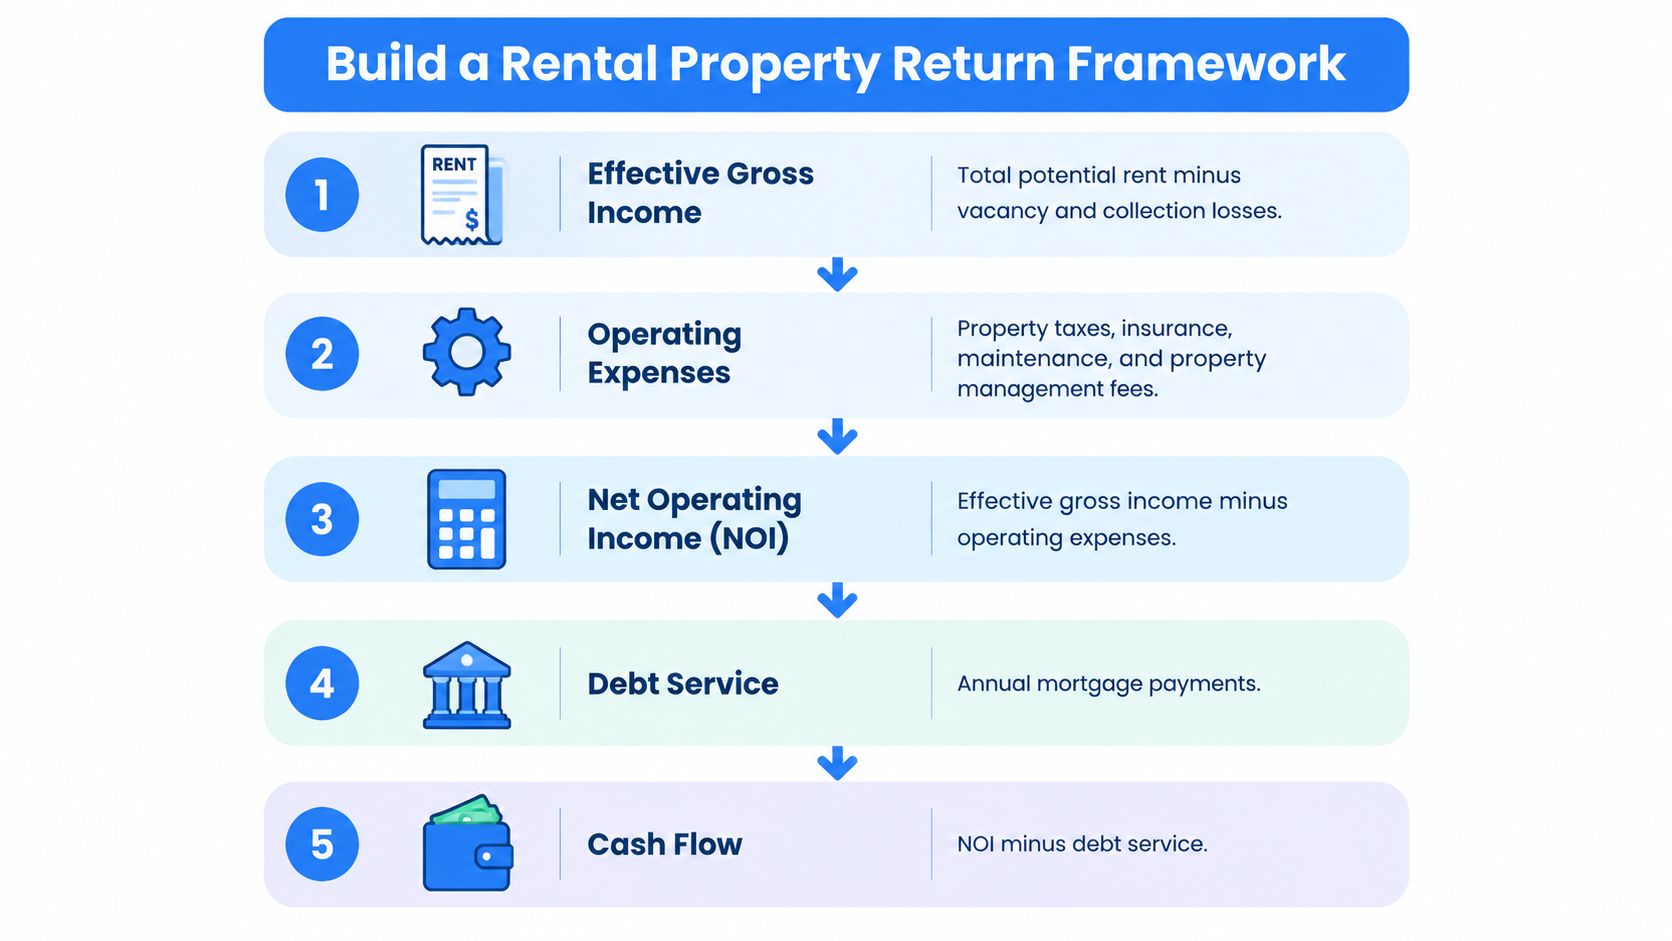
Establish the operating yield
Effective gross income is potential income after vacancy and collection losses. Subtract recurring operating expenses to reach net operating income, or NOI.
Include property taxes, insurance, routine maintenance, management, owner-paid utilities, and applicable assessments. Keep property taxes separate from the owner's income taxes, which aren't part of NOI.
A stabilized cap rate of roughly 4%–6% can be a useful reference in major, lower-risk metropolitan markets, but cap rate specifically means NOI divided by property value, excluding debt service, income taxes, and depreciation, as discussed in this academic analysis of capitalization rates and subsequent returns.
Treat replacement reserves consistently. If your market comparison excludes major capital replacements from NOI, show those reserves separately rather than omitting them from investor cash flow.
Return calculation map
| Calculation | Formula | Decision use |
|---|---|---|
| Effective gross income | Potential income less vacancy and collection losses | Estimate collectible income |
| NOI | Effective gross income less operating expenses | Evaluate property operations |
| Cap rate | NOI ÷ property value | Compare unlevered yields |
| Distributable cash flow | NOI less debt service and separately budgeted capital reserves | Estimate spendable cash |
| Cash-on-cash return | Annual pre-tax cash flow ÷ total cash invested | Evaluate equity income |
| Debt-service coverage | NOI ÷ annual debt service | Assess repayment capacity |
| Total equity return | Cash distributions plus net equity gains, relative to invested equity | Evaluate the broader investment |
Measure the owner's outcome
Your cash investment includes more than the down payment. Add acquisition expenses, initial improvements, financing charges, and any cash you must commit to the project, while documenting how you treat reserve balances.
Debt-service coverage checks whether operating income can support scheduled loan payments. It's a safety measure, not a substitute for cash-on-cash return, because investors still need money for capital work and unexpected costs.
For a closer look at the operating calculation, use this guide to calculating cap rate. If you already own the property and are deciding whether to keep it, Cyber Homes' discussion of cash sale vs rental income provides a useful starting point for framing that separate decision.
Practical rule: Approve the property's economics before using leverage to improve the projected equity return.
Finally, distinguish principal reduction from appreciation. Principal paydown follows the loan's amortization schedule; appreciation is an uncertain change in market value. Both can contribute to total return, but neither should be presented as cash available for current bills.
Compare Property Types and Market Profiles
A stabilized apartment property, a single-family rental, and a leased commercial building shouldn't receive identical return targets merely because they're all rentals. Their income interruptions, management needs, and replacement costs require different questions.
Compare assets with similar use, condition, tenant demand, and lease structure. Otherwise, you may interpret a higher quoted yield as a bargain when you're accepting more operating or financing risk.
Match the target to the asset
For a single-family rental, examine the financial effect of a complete gap between tenants. The property may be straightforward to manage, but there's no income from other units while the home is empty.
For multifamily property, review the rent roll unit by unit. Multiple rent payments can soften an individual vacancy, but shared systems, recurring turnover, and building-wide repairs still require careful budgeting.
For nonresidential rentals, read the leases rather than assuming who pays which expenses. Tenant obligations, renewal options, improvement commitments, and the cost of finding a replacement occupant can materially change the investment you're buying.
Property-type underwriting questions
| Property profile | Return strength to test | Risk to investigate | Financing sensitivity |
|---|---|---|---|
| Stabilized single-family rental | Reliable collections and manageable upkeep | Vacancy between tenants, major system replacements | Ability to carry payments without rent |
| Stabilized multifamily | Consistent building-level operating income | Turnover, shared-system repairs, expense allocation | Lender treatment of existing leases |
| Renovation or lease-up rental | Achievable income after completion | Construction delays and leasing assumptions | Carry costs before stabilization |
| Nonresidential rental | Lease-supported net income | Tenant concentration and reletting costs | Lease duration relative to loan maturity |
Put market statistics in their proper place
The rental-market indicators compiled by WealthyBud report U.S. asking rents of $1,951 in May 2026, up 2.0% year over year, a tracked median gross rental yield of 4.42%, and a national apartment cap rate near 5.04%; the same compilation describes New York City's 2025–2026 operating-cost projection of 4.8%, including a projected 17.7% insurance increase.
Those measures cover different populations, locations, and expense definitions. They aren't interchangeable targets, and a local cost projection shouldn't become a national expense assumption.
Use such context to challenge a proposal, then obtain property-specific evidence. A lower-yielding rental with demonstrable tenant demand and accessible financing may suit a conservative investor better than a higher-yielding property with uncertain insurance availability or persistent vacancy.
The right comparison is return relative to the risks you must carry, not the largest percentage on a market-ranking page.
What Counts as a Good Return in Practice
A good return leaves a defensible margin after ordinary expenses, debt obligations, and planned reserves. It should also compensate you for the work, uncertainty, and limited access to invested capital.
The stabilized cap-rate reference already discussed is a screening tool, not an automatic approval range. Your required return should rise when the property demands substantial rehabilitation, uncertain leasing, or a difficult refinance.

Treat the additional cash-on-cash and total-return targets illustrated above as conceptual targets, not universal underwriting standards. They don't establish what a particular property will earn.
Replace headline yield with normalized yield
Gross yield ignores the costs of operating the rental. Normalized yield uses income and expenses that reasonably represent ongoing ownership, rather than an unusually favorable period or a seller's incomplete budget.
Popular guidance describes 6%–10% annual ROI or 5%–8% cap rates as attractive, but the DealMachine discussion of rental-property ROI also reports that revenue across 13,471 apartment communities increased 2.7% in 2025, while operating expenses rose 4.6%. That's a direct reason to test expenses independently instead of assuming rent increases will preserve your margin.
Ask what supports an unusually high yield:
- Property condition: Are roof, plumbing, electrical, or mechanical replacements approaching?
- Tenant performance: Does the rent roll show collectible income or merely scheduled charges?
- Market demand: Can comparable rentals support the projected rent without prolonged vacancy?
- Expense completeness: Are management, insurance, maintenance, and ownership-related taxes fully represented?
Improve the property without over-improving it
A renovation can make sense when it addresses a documented leasing problem, reduces recurring maintenance, or supports rent that comparable properties already achieve. It makes less sense when the return depends on tenants paying for finishes they haven't demonstrated they value.
For a location-specific planning resource, Ofir Engineering's Jacksonville rental renovation tips can help frame improvement choices. Confirm the scope with local contractors and compare the proposed result with competing rentals before committing capital.
A higher advertised return deserves more verification, not less.
When deciding what is a good return on rental property, require the deal to work with slower growth and realistic ownership costs. An attractive spreadsheet isn't enough if the operating margin disappears as soon as you replace optimistic assumptions with documented quotes.
Worked Examples and Sensitivity Analysis
The illustrative comparison below shows how the same acquisition can produce different operating results. These are hypothetical scenarios, not verified property results, and the illustrated cash-on-cash outcomes can't be independently checked without the associated equity investment and loan terms.
Use the comparison to follow how vacancy and expenses change NOI.
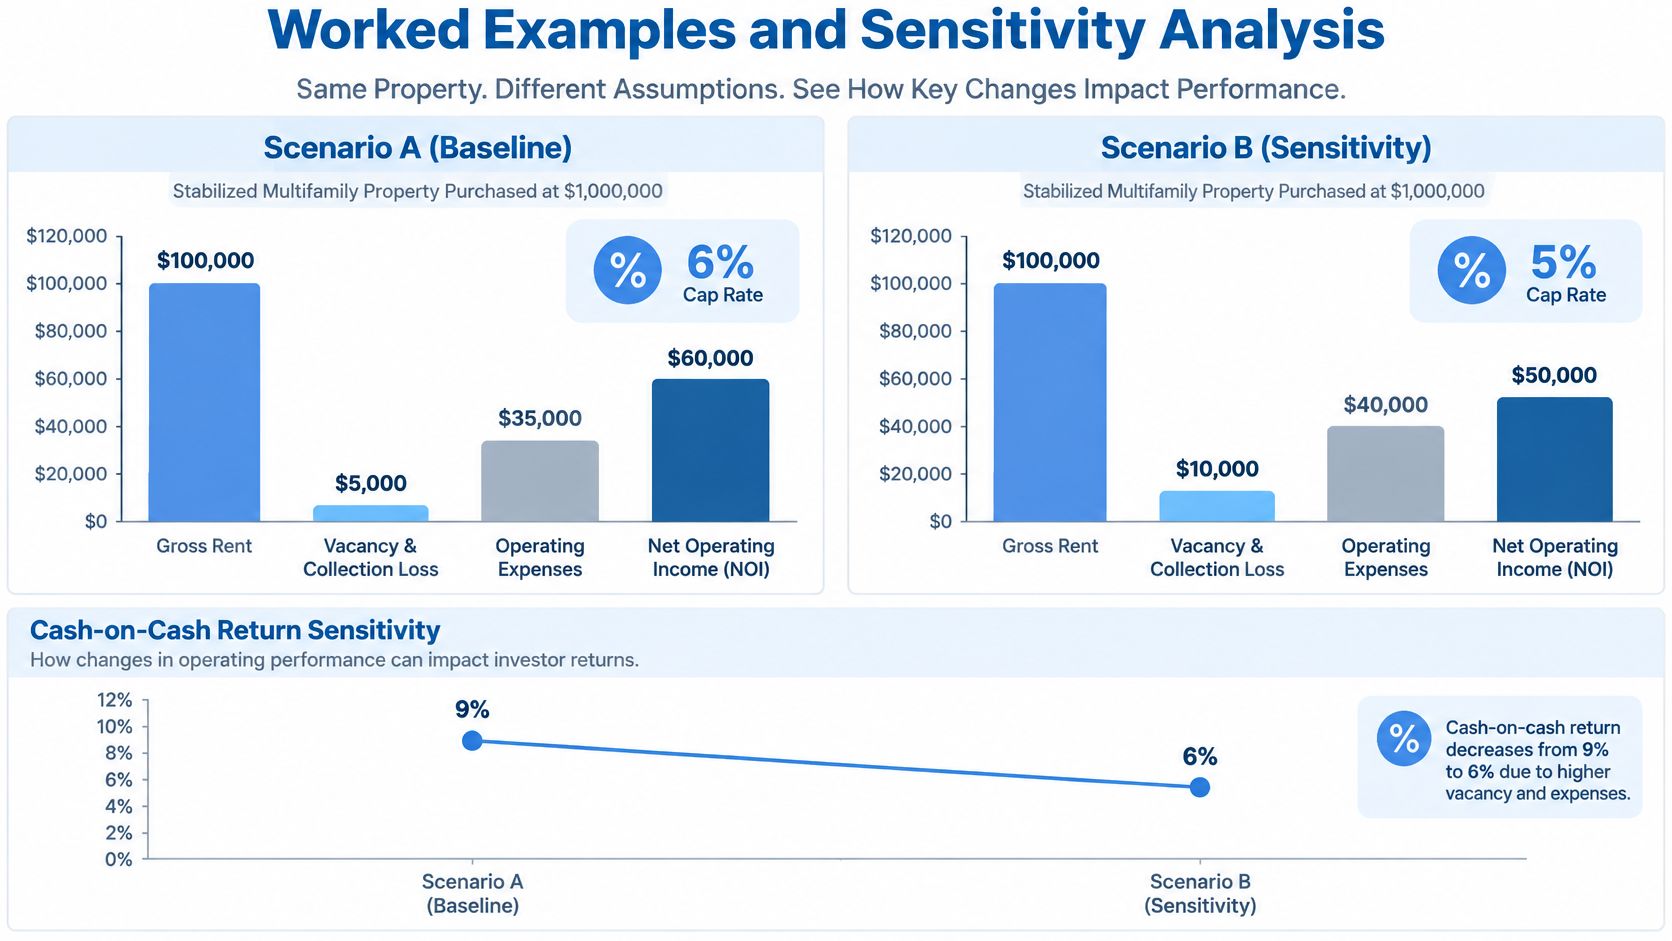
Work from the rent roll to the equity return
For a stabilized multifamily purchase, enter the contract price, scheduled rents, expected collection losses, and documented operating expenses. The subtraction produces NOI, which you divide by the acquisition value to calculate the going-in cap rate.
Next, enter the actual financing proposal. You need the loan amount, interest rate, payment structure, amortization schedule, and financing charges before calculating the investor's return.
The linked calculations are:
- Property yield: Divide normalized NOI by the property value.
- Equity cash flow: Subtract scheduled debt payments and separately budgeted capital reserves from NOI.
- Cash-on-cash return: Divide that annual cash flow by the cash committed under your stated methodology.
- Debt coverage: Divide NOI by annual debt service, using the lender's required expense treatment.
- First-year total equity return: Add distributions, scheduled principal reduction, and any assumed value change, subtract relevant costs, then compare with invested equity.
Without a complete loan quote, don't manufacture a cash-on-cash result. A rent-and-expense illustration can establish operating yield, but it can't establish financed performance.
A calculator can organize the inputs. RealtyAPI.io's tool lets you compare rental income potential, but the quality of the result still depends on the leases, expense records, and financing assumptions you enter.
Change the assumptions separately
Start by changing each major input individually. That identifies which assumption matters most before you combine adverse conditions into a downside case.
| Sensitivity test | What to change | What to watch |
|---|---|---|
| Vacancy | Longer gaps between paying tenants | Cash available after debt service |
| Rent | Lower achievable rents or concessions | Operating margin and coverage |
| Insurance | A property-specific higher renewal quote | Recurring expense burden |
| Repairs | More frequent maintenance or a major replacement | Liquidity, not just annual profit |
| Property taxes | A supportable post-acquisition estimate | Normalized ownership costs |
| Occupancy timing | Later completion or slower leasing | Peak cash needed before stabilization |
Break-even occupancy estimates the collected occupancy needed to cover the property's obligations. In a simplified model, divide operating expenses, debt service, and required cash reserves, less dependable non-rent income, by full-occupancy potential rent.
That shortcut assumes the expense budget is appropriate for the occupancy level. If expenses change materially as units fill, solve using fixed costs and the contribution left from occupied units after variable costs.
For an additional visual reference on rental-return analysis, use the following video.
Model renovation cash needs separately
A rental under renovation may have attractive stabilized economics but negative cash flow before completion. Contractors, insurance, taxes, utilities, and interest can require payment before tenants begin paying rent.
Build a period-by-period cash schedule through construction and lease-up. Identify the largest cumulative cash shortage, then determine whether committed funds can cover it.
Don't use expected appreciation to fill that shortage. The NYU Stern historical-return dataset reports real-estate price returns of 6.44% in 1999, 5.11% in 2000, 3.82% in 2002, 4.70% in 2006, and -4.23% in 2018, illustrating why appreciation isn't a guaranteed return component.
How Financing Changes Investor Returns
Choose financing around the property's current condition and investment timeline, not just the quoted rate. A loan that works for an occupied rental may be poorly matched to a building awaiting permits, repairs, or tenants.
For non-owner-occupied property, compare the cost of capital with the cash it allows you to preserve and the execution risk it helps you manage. Faster funding can be useful, but it doesn't excuse an unaffordable repayment structure.
Compare complete loan structures
Interest-only payments can reduce scheduled cash outflow during a bridge period, but they don't reduce principal. An amortizing payment includes principal reduction, which can build equity while leaving less distributable cash.
Points, origination charges, draw fees, extension costs, and required reserves also affect the investment. Request a written estimate rather than comparing rate quotes in isolation.
Financing choices for non-owner-occupied property
| Financing route | Best fit | Potential return trade-off | Question to ask |
|---|---|---|---|
| Conventional investment-property financing | Borrowers and properties meeting institutional requirements | Qualification and reserve demands can limit flexibility | What documentation and liquidity are required? |
| Private or hard money financing | Asset-focused transactions needing flexible execution | Higher financing costs can reduce net returns | What is the complete cost through repayment? |
| Bridge financing | Acquisition, stabilization, or a defined financing gap | Short maturity creates exit-timing exposure | Can the property refinance before maturity? |
| Rehab financing | Rentals requiring improvements before stabilization | Draw timing may require borrower advances | When are funds released, and what must be paid first? |
Protect liquidity during the transition
Conventional financing can require substantial funds beyond the closing amount. Fannie Mae's minimum-reserve policy generally calls for six months of the subject investment property's qualifying housing payment; a $3,000 monthly payment therefore implies $18,000 in eligible reserves, separate from down-payment and closing funds.
Don't confuse lender-required reserves with a complete project contingency. Your own budget must address the actual construction scope, anticipated income interruption, and potential delays.
For a broader comparison, review this investment-property financing guide. LendingXpress is an asset-focused private lending option for non-owner-occupied acquisitions, bridge transactions, and rehabilitation projects when traditional bank timing or qualification doesn't fit.
Financing check: A workable loan must carry the property through the transition, not merely fund the purchase.
Before accepting a proposal, confirm:
- Financing structure: How much equity remains available for unexpected costs?
- Draw mechanics: Must you complete work before receiving reimbursement?
- Payment timing: When does interest begin, and can the project support it?
- Exit requirements: What occupancy, income, and condition will the refinance lender require?
- Extension terms: What happens if construction or leasing takes longer?
A temporary operating loss can be acceptable when it's explicitly budgeted and supported by a credible stabilization plan. An unplanned funding gap is different, especially when the loan matures before the property can qualify for replacement financing.
Verify the Deal Before You Invest
A high projected ROI isn't a reason to relax due diligence. It's a reason to identify exactly which assumptions produce that result and what happens when they don't hold.
Before committing, assemble a file that another investor or lender could independently review.
Require evidence for the important inputs
- Income: Match the rent roll to leases, collections, and supportable market rents.
- Operating costs: Obtain insurance quotes, tax estimates, maintenance records, and management terms.
- Capital needs: Review inspections, contractor scopes, and replacement schedules.
- Liquidity: Verify that available funds cover the modeled cash shortage and contingency.
- Financing: Reconcile the written quote with the projected payment, fees, draws, and maturity.
- Exit: Document a repayment or refinance plan that doesn't depend on favorable market changes.
Keep tax benefits separate from operating cash
Depreciation can affect after-tax returns, but it doesn't deposit money into the property's operating account. Under IRS Publication 527, qualifying residential rental buildings generally use straight-line MACRS depreciation over 27.5 years; a $275,000 depreciable building basis implies approximately $10,000 annually before the mid-month convention and applicable adjustments, with land excluded.
Classification matters too: residential rental property generally uses that recovery period, while nonresidential real property generally uses 39 years under the general depreciation system, as described in IRS guidance distinguishing real-property classifications. Have a qualified tax adviser confirm the treatment and whether deductions are currently usable.
The final decision should rest on documented income, manageable downside exposure, sufficient liquidity, and financing that fits the work ahead. If the purchase only succeeds under the most optimistic version of every assumption, renegotiate the price or structure before proceeding.
LendingXpress offers private financing for non-owner-occupied rental acquisitions, bridge needs, and rehabilitation projects, with structures aligned to the property's investment plan. Investors, mortgage brokers, and real estate agents can visit LendingXpress to discuss the purchase, renovation budget, expected rental income, and repayment strategy when traditional bank timing or qualification doesn't fit.